10 volunteers were equipped with HTC Wildfire-S smartphones, whose Wi-Fi interfaces were configured to operate in ad hoc mode. Each smartphone ran DodwanDroid, an Android application based on DoDWAN, as well as another application recording GPS locations and radio contacts.
During the experiment the volunteers were asked to roam a small university campus (covering roughly a 420 m x 160 m area), staying outdoors (because of the GPS recording), while using the DodwanDroid app to exchange short-text messages on a public channel (meaning every message published by one volunteer was meant to be received by all other volunteers). The experiment lasted about 25 minutes, but the volunteers were requested to start DodwanDroid on their smartphone shortly after they began walking in the campus, and to stop it shortly before the 25-minute deadline. They were also requested to stop publishing messages a couple of minutes before stopping the DodwanDroid application, thus giving the last messages published a chance to disseminate for a while.
Log files were collected after the field experiment, and a video was produced (among other things) based on data extracted from these log files. This video shows how the volunteers moved during the field experiment, and how their smartphones managed to exchange messages. The video covers the whole duration of the field experiment (i.e., a bit more than 25 minutes), but it is accelerated 4 times.
Each moving node in the video represents a volunteer, or more specifically the smartphone he/she is carrying. A node is shown grey as long as the DodwanDroid app is not running on the smartphone, and it turns red when DodwanDroid is started.
An edge between two nodes blinks grey whenever a control message is transferred between these nodes (in any direction). It blinks red for the transfer of an application-level message (i.e., one of the messages published by the volunteers).
This video has been produced using the LEPTON platform. This platform is mostly meant to emulate an opportunistic network, but it can also replay mobility traces, contact traces, and application-level traces collected during field experiments such as this one.
The log files collected after the field experiment have been analysed. Some of the main statistical figures thus obtained are shown in the table below (Table I).
| Metric | Values (* = min / max / avg / stdev values) |
| Duration of the experiment | 25’15" |
| Nb. of nodes involved in the experiment | 10 |
| Nb. of active nodes |
2.0 / 10.0 / 9.5 / 1.5 (*)
|
| Activity duration per node |
21’35" / 23’53" / 23’06" / 41" (*)
|
| Average number of neighbors per node |
0.0 / 2.7 / 1.2 / 0.5 (*)
|
| Number of contacts | 163 |
| Durations of contacts |
00" / 10’16" / 48" / 01’11" (*)
|
| Number of inter-contacts | 119 |
| Durations of inter-contacts |
04" / 18’12" / 04’01" / 03’37" (*)
|
| Number of messages published | 249 |
| Number of receive events | 2234 (delivery ratio: 99.6%) |
| Message delivery delays |
00" / 18’16" / 02’30" / 02’08" (*)
|
| Distances covered during msg transfers (m.) |
0.0 / 171.8 / 55.7 / 32.6 (*)
|
In the analysis below any message considered is an application-level message, that is, a message published by one of the volunteers during the field experiment. The transmission of such a message is depicted by an edge blinking red in the video presented above.
The last line in Table I provides interesting figures about the distances covered by these messages as they were transferred between neighbor nodes. Some messages got transmitted over up to 172 meters, with an average distance of 56 meters. Such rather long transmission distances could of course be observed because the volunteers stayed outdoors while roaming the campus.
The figure below shows a projection of all the message transfers that were recorded during the field experiment (click on the image to see it in full size). Each red segment depicts the transfer of a message from a sender to a receiver.
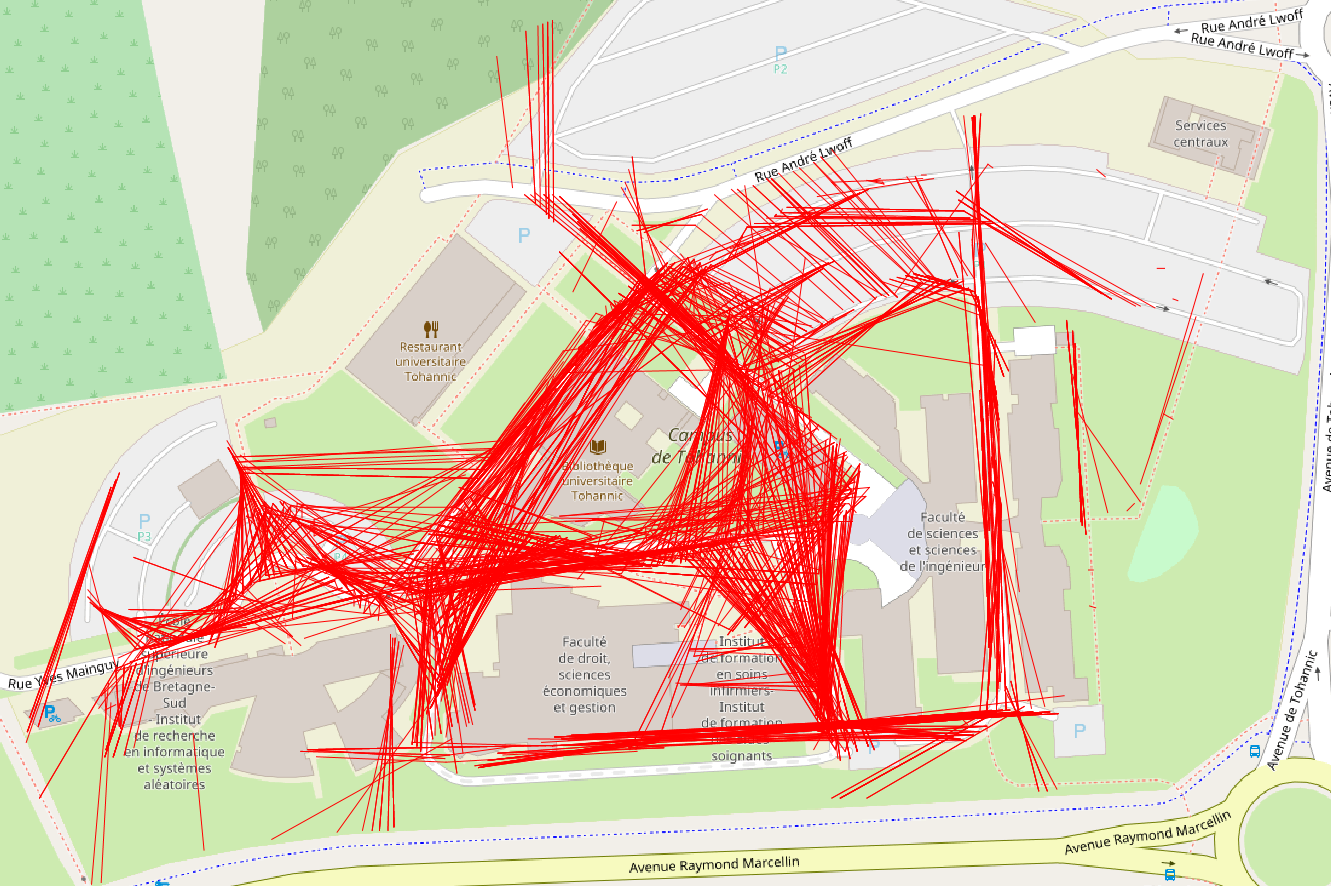
As expected, most of the transmissions recorded in the log files occurred over line-of-sight paths. Yet, the figure shows that some transmissions also occurred through buildings. This can also be observed when playing the video. Indeed, a thorough observation of these transmissions through buildings shows that they actually occurred over the lowest buildings of the campus, and through openings (e.g., doors and windows) in higher buildings. In any case, observing that small mobile devices such as smartphones operating in ad hoc mode managed to exchange messages in such challenged conditions, and over such distances, is an unexpected outcome of this field experiment.
The figure below shows the cumulated distribution function of the distances covered as messages got transferred between neighbor nodes. It can be observed that only a small amount of transmissions were performed at short range (e.g., 12% below 20 meters), while a significant amount of transmissions were performed at rather long range (e.g., 40% above 60 meters).

The fact that many transmissions occurred over long distances is a direct consequence of the way DoDWAN operates on mobile nodes. Indeed, as soon as a radio contact is established between two nodes, they start gossiping and try to exchange the messages stored in their cache. Once this exchange phase is complete, the two neighbor nodes do not have anything more to exchange, unless new messages are published locally on either of them, or unless one of them manages to obtain new messages from a third-party node.
This behavior is illustrated in the figure below, which shows what happened during a contact that occurred between nodes dmis12 and dmis13 during the field experiment. This contact lasted exactly 1'46" (from 15:29:22 to 15:31:08).

The purple line in the figure shows the evolution of the distance between nodes dmis12 and dmis13 during this contact. It can be observed that the contact was established as the two nodes were almost 160 meters apart. This distance progressively decreased until the nodes were only 2 meters apart, then it increased again until the contact was broken. Such a V-shaped line depicts typically the evolution of the distance between two mobile devices whose carriers first walk toward each other, pass each other, and finally walk away.
Each green vertical impulse in the figure marks the transmission of a message between nodes dmis12 and dmis13 (in any direction). 38 messages got exchanged during that contact, but 29 of them actually got transferred during the first 14" of the contact, as both nodes still had plenty of original messages in their local cache. This is a perfect illustration of the standard behavior of DoDWAN nodes, as described above, and it explains why a majority of message transfers occurred over long distances during the field experiment.
The volunteers published 249 messages during this experiment, and 2234 receive events were recorded in the log files. Since each message published on a smartphone could be received by at most 9 other smartphones, the delivery ratio is 2234/(249*9)=99.6%. Indeed, only two messages were not received by all possible receivers. These two messages were both published by node dmis01 at 15:42:26 and 15:43:07 respectively, that is, only a few minutes before the experiment's deadline, and as the smartphones were progressively being turned off.
As shown in Table I, the average delivery delay observed in the log files is 2'30", and the maximum delivery delay is 18'16". The figure below shows the cumulated distribution function of the average delays observed for all the message deliveries recorded in the log files. It can be observed that 50% of the deliveries occurred less than 2'20" after a message was published, and 90% of the deliveries occurred in less than 4'00".

The short video below shows the propagation of a single message, that was published on node dmis09 at 15:40:33 during the field experiment. This message then propagated from node to node, and it reached the latest node at 15:41:24, that is, 51 seconds later.
In this video, a node is marked with a blue circle as soon as it becomes a carrier of the message originally published by node dmis09. The video starts 5 seconds before the message is published on node dmis09, and it terminates 5 seconds after the last delivery of the message.
As shown in this video, as soon as the message got published on node dmis09 it started disseminating, and reached 6 other nodes in less than 2.5". Yet it still took 48.5" for the message to reach the 3 remaining nodes.
While watching this video, one may wonder why the dissemination of the message is not faster. One of the reasons is that establishing a contact between two nodes is sometimes difficult, because of radio interferences. Another reason is that the single message we are following in this video is not the only message the nodes must exchange. Two nodes engaged in a radio contact may have dozens of other messages to exchange. This is why passing a message from one node to the next sometimes takes a while.